Discover the features
IMPROVE PRODUCTION LEVEL
WITH
METRICITY
Customisable tools
Lets you store, monitor and visualise your most relevant KPIs in a single place.
Flexibility
Remind your co-worker to submit data without accessing to your account (eg: email, token-link)
Shareability
Give external teams, partners, and clients simple and secure access to your analytics
Discover the features
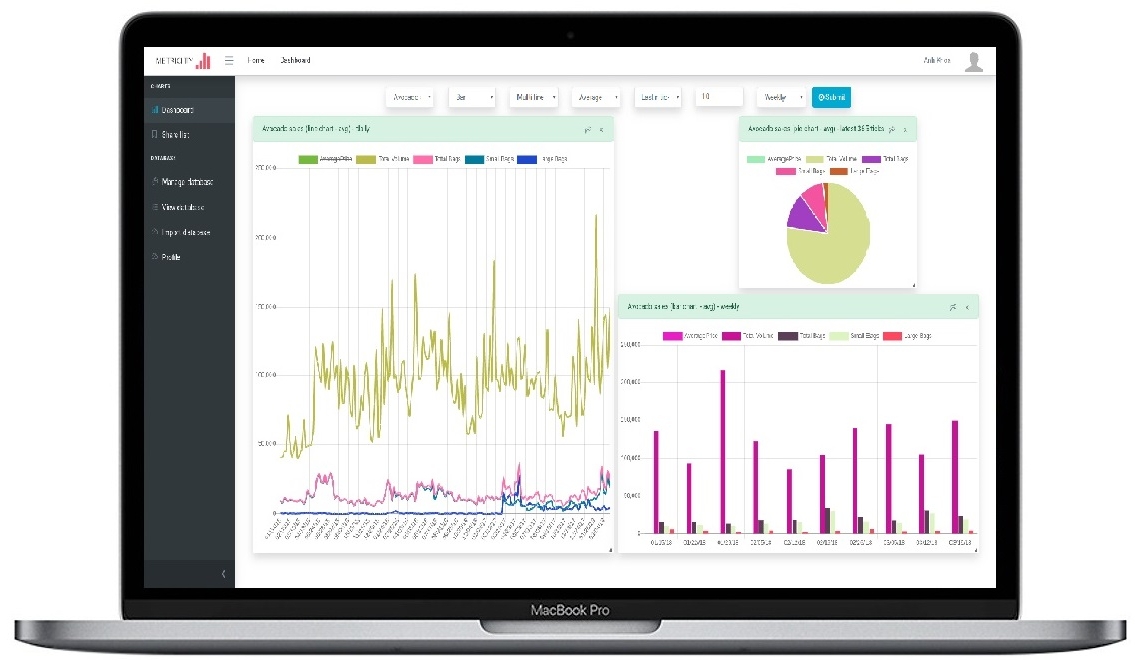
Visual analytics at your fingertips
Interact directly with your data using visual data discovery. Instantly spot trends and figure out how your business is performing. Compare this month to last month or the same period last year with a single click. Use filters, segments and automatic trend lines.
Discover the features
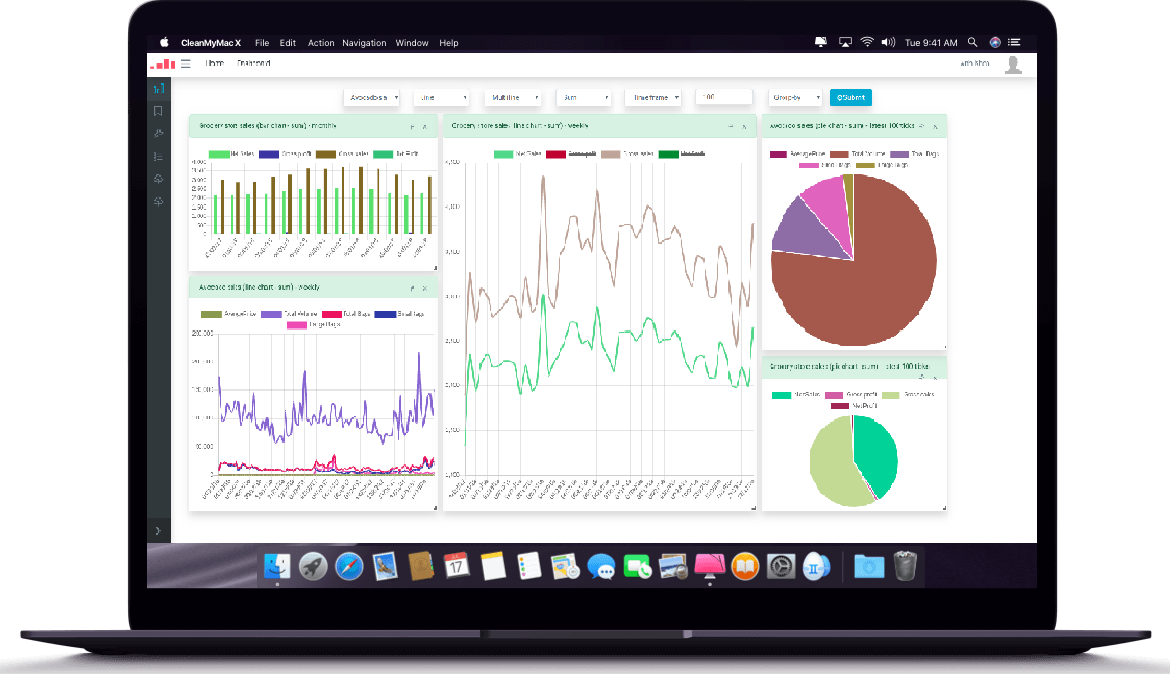
Customize your dashboards
Custom data visualizations Drag-and-drop data visualizations from the palette to start assembling your custom dashboard. Choose from standard data visualizations: line charts, bar charts, and scatter plots. The choice is yours.
Discover the features
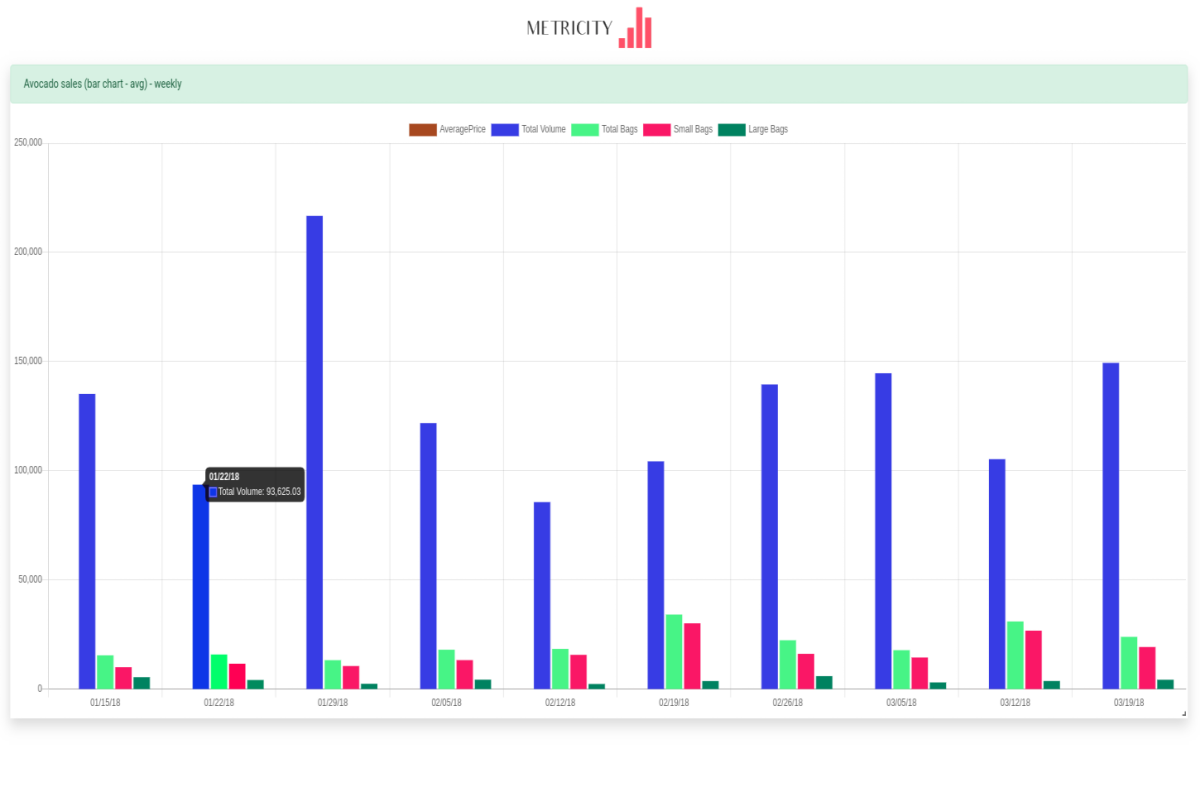
Flexible inputs and Shareable analytics
Too much data to handle alone? Worry not. We also support flexible methods to help you and your co-workers submit data on schedule.
Give external teams, partners, and clients simple and secure access to your Visual analytics in view-only mode

Ho Chi Minh Office
CoderSchool, 4 Ton Dan, Q4
Ho Chi Minh city, Vietnam